Precision Measurement Services – Surface Finish Measurement
Precision Measurement Services – Surface Finish Measurement
Surface finish measurement is one of the most misunderstood areas of metrology. Numerical Engineering has been evaluating surfaces for decades and we have the equipment and expertise to provide answers to you surface finish questions. We have 2D contact profiling and 3D profiling capabilities, along with non-contact 2D and 3D capability. Our eZsurf system can provide all the latest profile, roughness, and waviness parameters utilizing a wide range of filters and analysis techniques. We can provide measurement services with our equipment or on site with your equipment outfitted with our eZsurf Upgrade System
Example 2DParameters Available
Ft Pa Pdsm Phsc Pku Pm0 Pm2 Pm4
Pp Ppc Pq Ps Psk Psm Pt Pv PVc
Ra Ra1 Ra1l Ra7 Ra7l Rc Rcl Rdmd Rdmn Rdq
Rdsk Rhsc Rk Rk+vk Rku Rm0 Rm2 Rm4 Rmax
Rmq Rmr1 Rmr2 Rp Rpc Rpk Rpk* Rpk/k Rpk+k Rpm
Rpm/3z Rpm7 Rpm7l Rpq Rq Rs Rsk Rsm
Rt Rtwi Rv RVc Rvk Rvk* Rvk/k Rvm Rvo Rvq
Ry Rz1max RzDIN RzJIS R3z
Wa Wc Wcvx Wcvxl Wcvxm Wdq
Weslp Weslpl Wlslp Wlslpl Wp Wpc Wpl Wpr Wq
Ws Wseg Wsegl Wsm Wt Wtc Wv Wvda Wvdas
Wvdc Wvdd Wvddl Wvdm Wvdmp Wvoid
AR AW R Rx W Wte Wx
Bearing Ratios (tpa/tpi, Pmr/Rmr)
Htp Values (PHtp/RHtp)
Example Filters Available
Gaussian
Spline Based Gaussian (with adjustable tension)
Valley Suppression (ISO 13565-1 – 1996)
Robust Spline-Based Gaussian (based on robust regression)
Morphological Closing Filter (circular element applied to waviness profile)
Morphological Opening Filter (circular element applied to waviness profile)
Profile Analysis
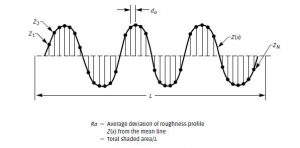
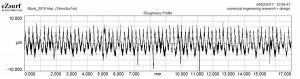
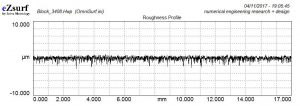
Sometimes a parameter value or number is not enough. Sometimes we need a picture to determine if a surface is suitable for an application. Consider the profiles below; both surfaces have the exact same Ra roughness value, yet their functional behaviors would be very different.
Processing example: so how do we get from….. to a (honed) surface like this?
With a progressive honing process of course. All done with profile pictures and the aid of the Bearing Area Curves.
Trouble Shooting
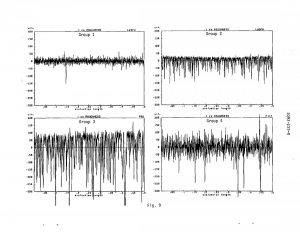
Simple profile measurements can provide insight to a multitude of manufacturing problems. Chatter, non cleanup, dull, chipped or loaded tooling, improper feed rates, etc. Random scratches and tool marks are very difficult to evaluate with single parameter values. Profile analysis helps with identifying these flaws and selecting appropriate evaluation parameters and limits. We have the experience to identify these problems and help you establish reasonable product specifications and process controls.
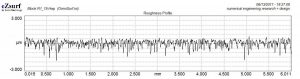
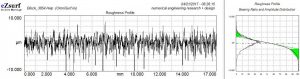
Non-Cleanup
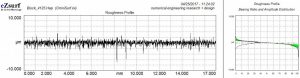
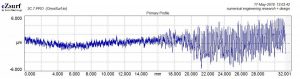
Tool Chatter
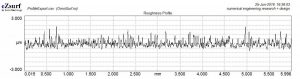
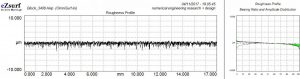
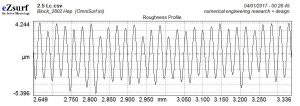
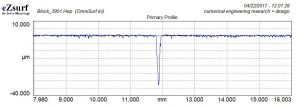
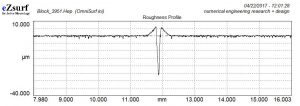
Sometimes it’s not the part! Sometimes the measurements are just bad. Incorrect instrument setup, poor part mounting, worn or damaged detectors, or dirt can produce erroneous results. When we see nice sinusoidal patterns we immediately suspect vibration problems with either the measurement process or the machining process. In the case below, the measurement system drive motor excited a probe that was too long and not nearly stiff enough. Sinusoidal surfaces are exceedingly difficult to manufacture……..on purpose anyway.
Poor Probe Setup
Filter Selection
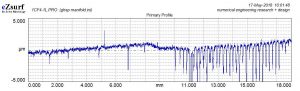
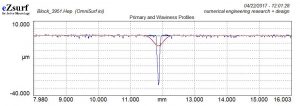
Selection of the “cutoff filter” is one of the most important (and often neglected) aspects of surface finish measurement. For most manufactured parts, a Gaussian filter with cutoff length of .030” (0.8 mm) is appropriate. But when our surfaces have pits, deep scratches, steps, and other anomalies, strange things start to happen. Take the example below. We have a smooth surface with a deep scratch or pit (actual profile) and calculate roughness with a .030” cutoff filter (filtered profile). Whaaaaaaat happened?
Well the filtering system first calculates the waviness (in red) using the .030” cutoff filter. Notice how the waviness drops into the valley?
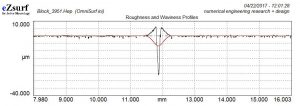
Then the waviness (in red again) is subtracted from the profile (in blue) to produce the roughness (in black). The (calculated) roughness is what all the roughness parameters are calculated from. Notice that not only is there a couple (new) large peaks in the filtered profile, the depth of the valley is decreased.
There are a number of solutions to these types of problems. We can measure your parts to help you develop appropriate measurement and analysis techniques for your application.
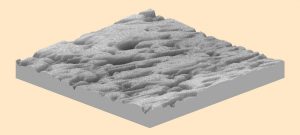
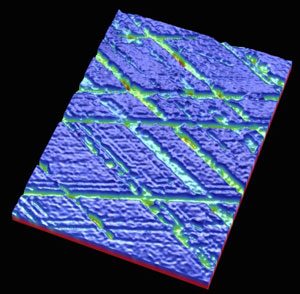
3D Measurement
3D measurement can be particularly helpful when it comes to getting a picture of what is going on with a surface. The simulated photo (right) generated from a 3D measurement of the Tool Chatter example above shows the supposition of the radial vibration of the boring tool on the circumferential and axial motion of the tool.
3D perspective of an injection molded part shows that the filler material is producing the roughness on the surface rather than the mold imparting the roughness on the part.
Color contour maps highlight difference between peaks, valleys, pits and other surface features
The oil carrying capacity of a power cylinder bore wall is an important factor for any engine or compressor. Our state of the art surface finish analysis software provides advanced parameters for evaluation of “stratified” plateau honed surfaces, bearing raceways, and any load bearing surface. We have worked with the ANSI B46.1 Surface Texture standards committee and instrument manufacturers for two decades developing techniques for measuring load bearing surfaces.
Plateau Honing?
To plateau hone or not to plateau hone. We have been helping manufacturers answer this question for decades. It depends on the application but the first step is to characterize the current surface roughness and product performance characteristics. The profiles below show a comparison of typical plateau and non-plateau surface. Sometimes just smoother is better. We can help determine what type of surface is best for your product through process development and surface finish analysis.
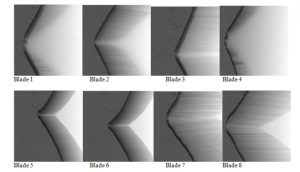
Example 3D measurement comparison of saw blade teeth.